What will the climate be like
in the next 100,000 years?
Talk to the Royal Meteorological Society, 19th January, 2000
Contents
- Why we need to know about future climate
- What we need to know about the future climate
- How the future climate has been estimated
- Further help required from dynamic climatology
Why we need to know
- Radioactive waste disposal has to be shown to give negligible risk for all time.
- Modelling the evolution of radioactive waste repositories needs to include environmental change (e.g. groundwater fluxes).
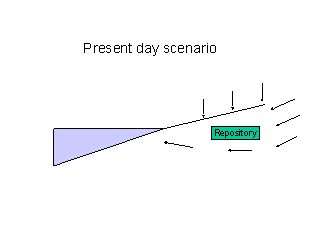
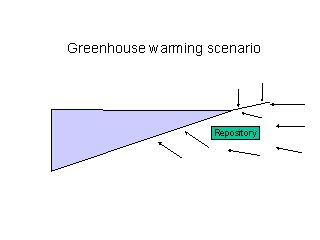
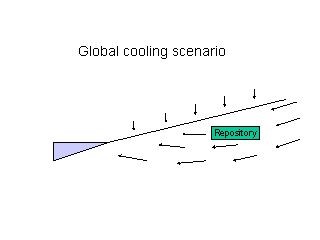
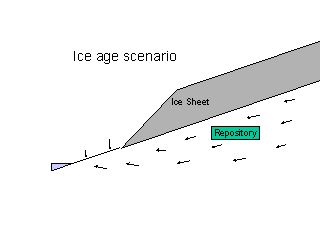
- Many Low Level Radioactive waste repositories are at coastal locations, for instance in France, Sweden, UK and Japan
What we need to know
To calculate possible doses incurred by future generations requires modelling of groundwater transport of radionuclides and subsequent likely consumption rates of contaminated food. For this the data required includes:- Infiltration rate
- Groundwater flow rates and directions
- Crops likely to be grown
- Typical food consumption by residents
- Global Sea Level
- Local Sea Level
- Local rainfall rates
- Local temperature
- Growing season characteristics
- Permafrost depth
- Ice sheet thickness and temperature
Between the scenarios the precipitation and sea level change, altering the groundwater flow and thus the time taken for contaminant to reach the surface, and the location where it reaches the biosphere.
How the future has been estimated
- Past data - e.g. core data
- Estimates of greenhouse effect
- LLN model for global parameters
- Use of ‘Climate analogues’ to estimate precipitation
- Consider various scenarios
Typical predictions
- Climate sequence
- Accompanying sea levels and temperatures
- Rainfall rates

Figure 3.8 from: Berger A. and Loutre M. F., 1997 . Climate modelling : the LLN 2-D climate model. In : Glaciation and Hydrogeology. Proceedings of the workshop on the impact of climatic change and glaciarion on rock stresses, groundwater flow and hydrochemistry. Past, present and future. King-Clayton L., Ericsson L.O., Kautsky F. (Eds), SKI, NKS, SKB, Stockholm, 16-19.
The Figure is Berger et al's LLN 2D climate model of Northern Hemisphere ice volumes of the last 200 000 years and 130 000 years into the future based on the natural CO2 concentration of Jouzel et al (1993) and a present day Greenland ice sheet compared to three alternative scenarios: (i) the Greenland ice sheet is assumed to be totally melted but the natural CO2 concentration is used (dotted line); (ii) starting with the present day Greenland ice sheet, but with a high level C02 scenario (IPCC S75, dashed line); (iii) starting with the present day Greenland ice sheet, but with a low level C02 scenario (IPCC S55, longer dashed line). From Berger, Loutre & Gallee (1996).
Help Needed
- Estimates of future atmospheric CO2 concentrations for over 10,000 years.
- Forecasts of future regional climate
- ‘Downscaling’ from regional climate to local rainfall and temperature.
- Consistent sea level predictions
- Uncertainties
- CO2 estimates
- climate driving forces
- global climate forecast
- downscaling
Conclusions
- We need to predict the climate for the next 100,000 years.
- There are a large number of uncertainties
- Dynamic climatology could do more to help this process.
Back to Cooper and Caulcott Ltd home page